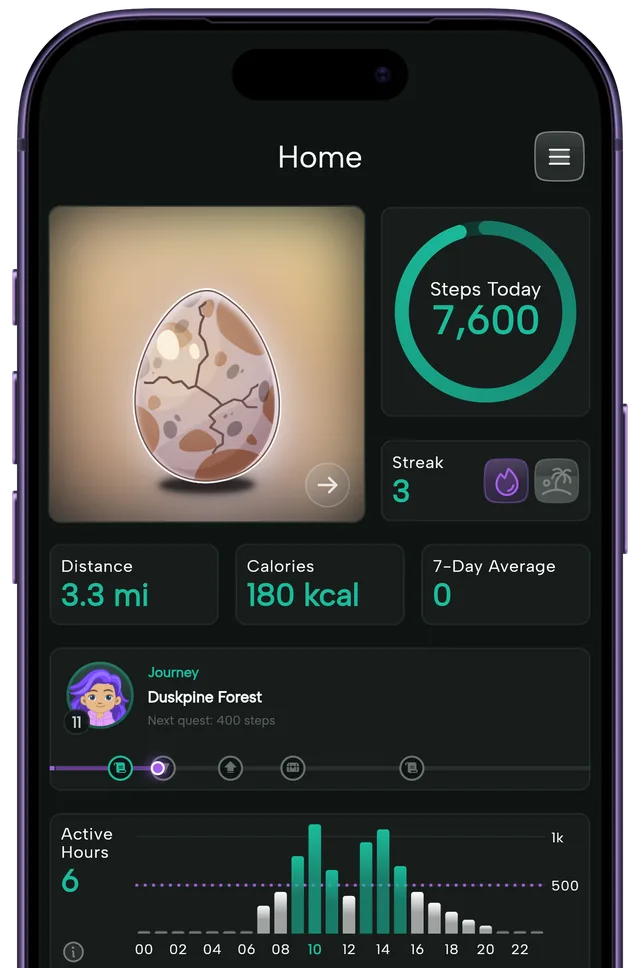
Step statistics, recaps and your Year Wrapped
See every walk on a calendar, open any day, and get weekly and monthly recaps. Statistics show your bigger trends, and every December you can look back on your year.


At a glance
- A calendar shows a Beast for every day you reached your goal.
- Open any day to see its Beast, steps, distance and how it compares.
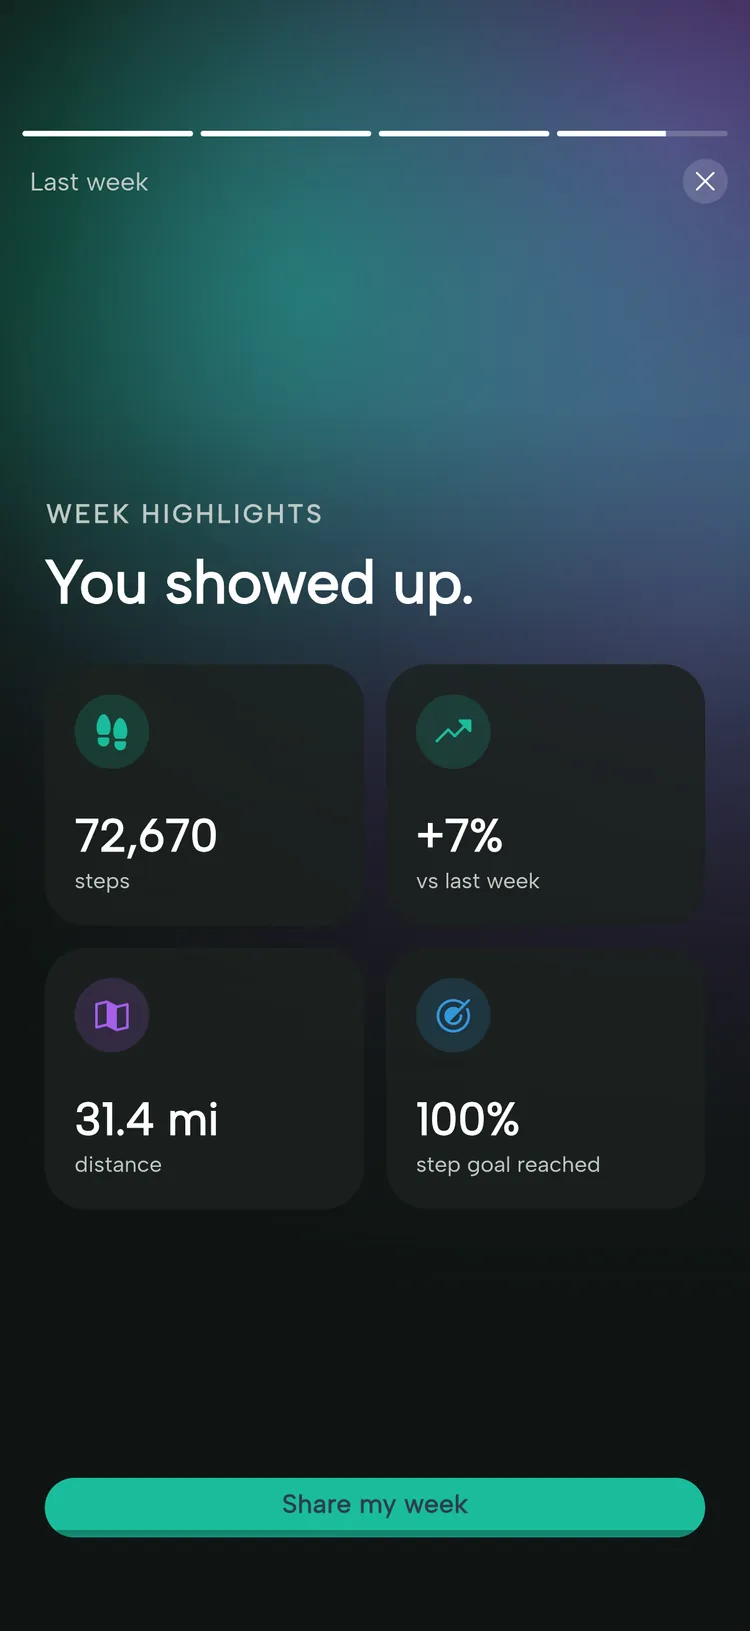
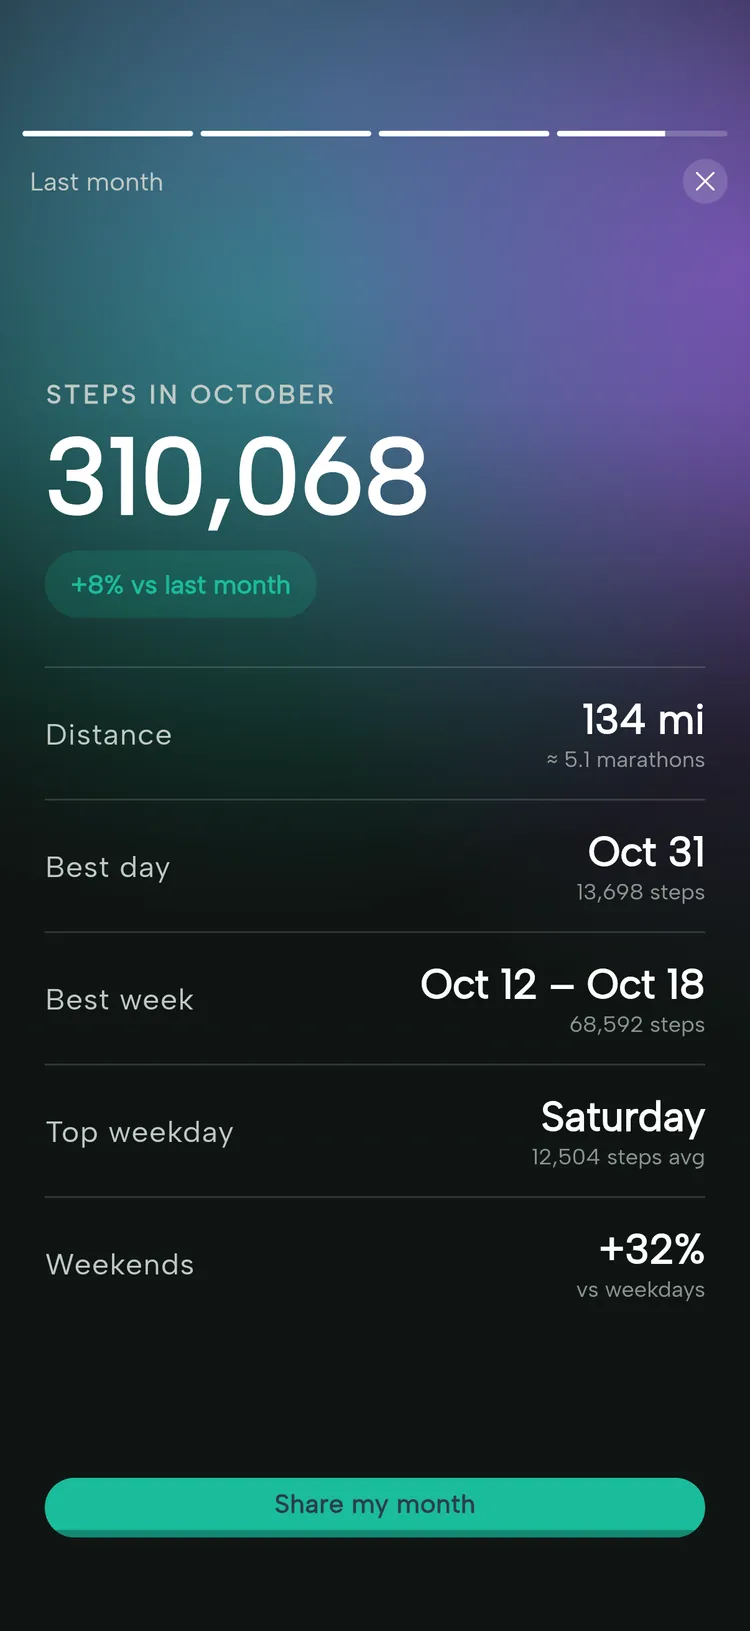
- Weekly and monthly recaps are shareable stories of your best moments.
- The statistics screen shows monthly charts, your yearly trend and a heat map of your goal days.
- Every December, Year Wrapped looks back on your whole year.
Every day on one calendar
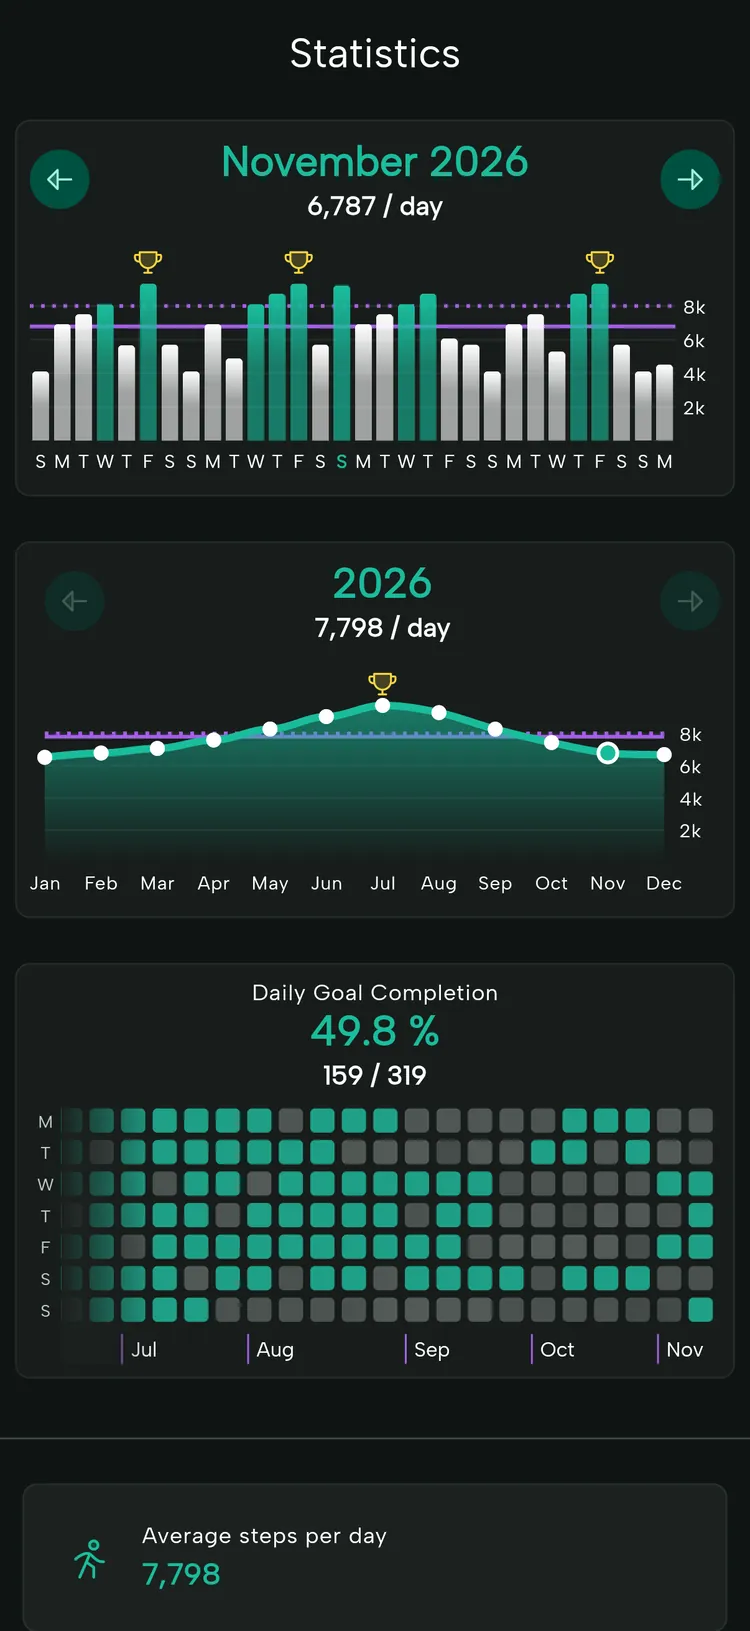
The calendar shows each month with a Beast on every day you reached your goal. At a glance you can see how consistent you have been, gaps included, in a calm and honest picture.
Treadmill and indoor walks fill in a day just like outdoor ones, so a rainy week still looks like a good one. The treadmill guide explains how to get a good count when you walk inside.
Open any day
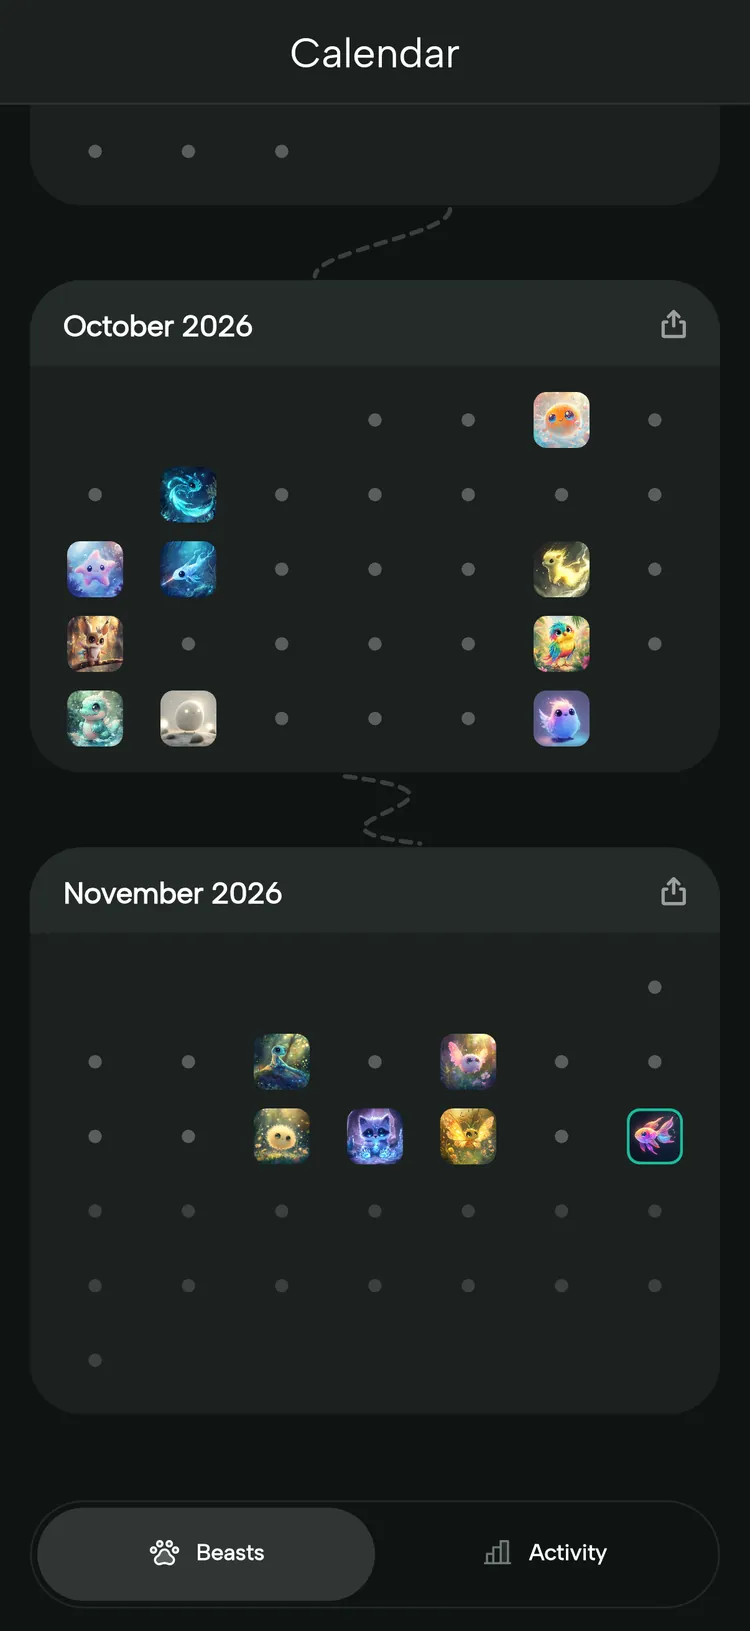
Tap a day and it opens up: the Beast you hatched, your steps, your distance and how the day went hour by hour. You can compare it with your average day and share it if it was a good one.
Every day has its own page, so you can flip back through the last few days and see which walks earned their Beast. It is a pleasant way to remember a day, and a useful one when a count looks odd and you want to see how the steps were spread out.
Statistics at a glance
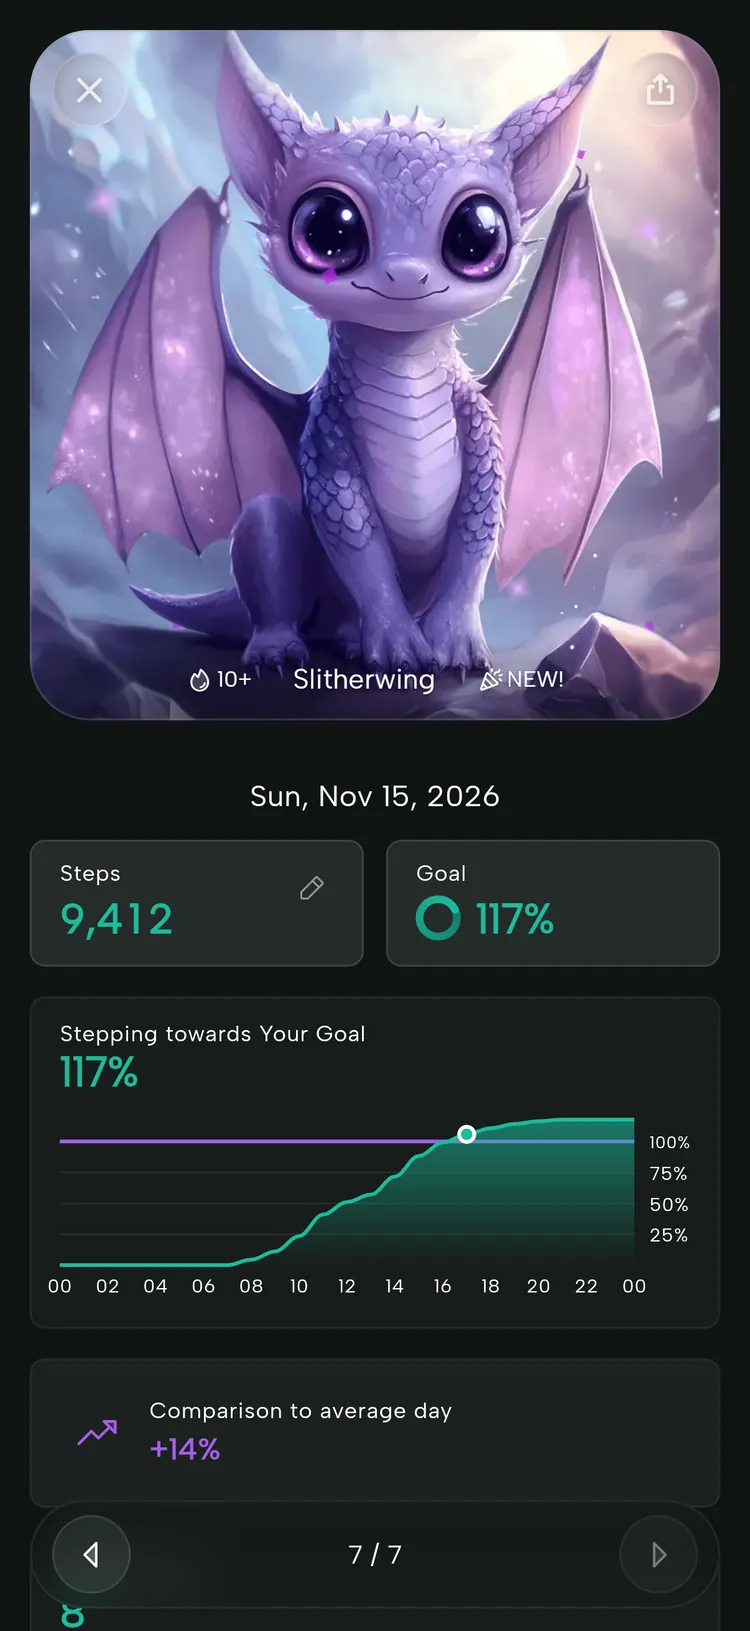
For the bigger picture, the statistics screen shows monthly charts, your yearly trend, your best days and a heat map of the days you reached your goal.
It answers the bigger questions, like whether you are walking more than you were last spring, and how steady your habit has really been once the good and the bad weeks are put side by side.
Weekly and monthly recaps
Each week and month the app puts together a short story of your best moments: your steps, your strongest day, the Beasts you collected. Swipe through it, then share it or keep it for yourself.
Recaps appear once you have tracked a few days, so a brand-new install has to walk a little first. After that they arrive on their own, which makes them a gentle reminder of how far a few ordinary days can add up.
Year Wrapped
Every December, the app looks back on your year: your steps, your goal days and, if you hatched any, your Beasts. You can still open it in January. It is built from the steps you recorded that year, and a Beasts page joins in once you have hatched some.
It is a good reason to check in once the weather turns, and the story is built to share. The streaks page shows how consistency builds up through the year.
Your history comes with you
Recent days are picked up from Apple Health or Health Connect when you open the app. History begins on the day you install the app, so it is worth installing early if you want your first year to be complete.
There is also a cloud backup, so a new phone can pick up where the old one left off.
Frequently asked questions
Keep exploring
Walking streaks
Count your goal days in a row and celebrate the milestones. A Lazy Day lets you plan a rest day.
Learn moreHatch and collect Beasts
Reach your step goal and an egg appears. Hatch it and add a new creature to a collection that keeps growing.
Learn moreUse your wearable
Steps your Apple Watch, Fitbit, Garmin or other wearable saves to Apple Health or Health Connect count too.
Learn moreTreadmill and indoor walking
Treadmill, walking pad or hallway laps: indoor steps count, hatch Beasts and move your Journey.
Learn more